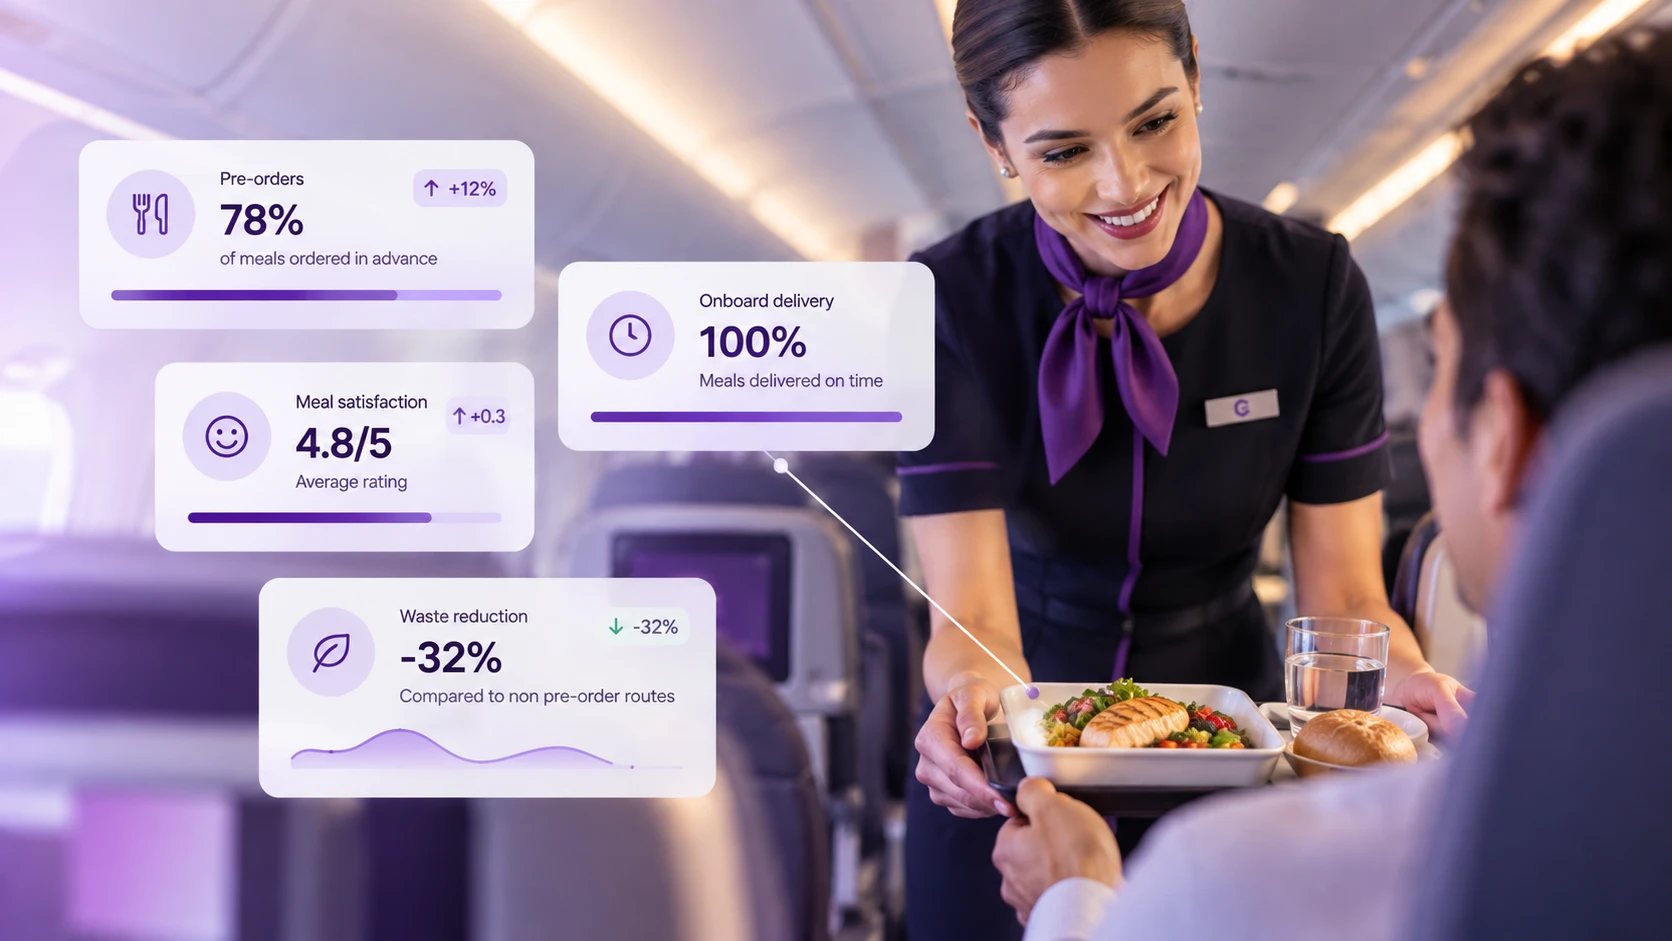



Cabin crew serving a meal, with onboard retail metrics shown alongside
Fulfillment

See what every passenger buys, everywhere they buy it

Pre-order, onboard, seatback and app sales usually live in separate reports. Omnevo Data Analytics puts every channel, route and product in one view, so commercial, catering and finance teams work from the same numbers.

Every channel
pre-order, onboard, seatback and app in one dataset
Per flight
revenue, uptake and waste down to sector level
One source
the same order data that drives fulfillment
Why it matters

Most operators can tell you what they sold last month. Far fewer can tell you which route, which product, which channel and which passenger segment drove it - or what was loaded and never sold.

Because every Omnevo order, from booking confirmation to the galley, runs through one platform, the data arrives already joined. Analytics is built on Apache Superset, so teams get interactive dashboards, drag-and-drop chart building and scheduled reports without a separate BI license. An AI layer on top flags anomalies, explains what changed and answers questions in plain language.

One view of onboard commerce,from basket to galley

Commercial performance and operational reality in the same report, not two spreadsheets reconciled at month end.

Cross-channel sales

Compare pre-order, onboard, seatback and app revenue on a single timeline.

Route and sector detail

Drill from network totals to an individual flight, cabin and service.

Conversion and basket

See where passengers browse, what they add and where they drop off.

Stock and waste

Track what was loaded, sold, returned and written off on every sector.

Built on Apache Superset

Interactive dashboards, cross-filtering, 40+ chart types and drag-and-drop exploration - no SQL needed.

AI-powered insights

Automatic anomaly alerts and plain-language summaries of what moved revenue, uptake or waste.

Ask in plain language

Type a question - 'which routes sold fewer hot meals this month?' - and get the chart back.

Alerts and scheduled reports

Threshold alerts and recurring reports delivered to email or Slack on your schedule.

Role-based access

Each team, base or partner sees only the data they are entitled to.

The data is already joined,because the orders are

Analytics sits on the same order backbone as commerce, onboard retail and logistics - nothing to stitch together after the fact.

Passenger shopping on a smartphone in an aircraft cabin

Every order captured

Sales from every channel land in one order record, tied to flight, seat and passenger.

Joined with operations

Loading, stock, returns and waste are matched to the same flights automatically.

Superset dashboards by role

Commercial, catering, finance and crew leads each get ready-made dashboards they can filter, extend and share.

AI surfaces what changed

Models flag unusual sales, stock or waste patterns, explain the likely cause and feed Dynamic Forecasting.

The Omnevo advantage

Reporting is only as good as the data underneath.Ours comes from the order itself.

Bolt-on analytics tools rebuild a picture from several systems and spend most of their effort reconciling them. Omnevo reports straight from the platform that took the order, packed the trolley and closed the sale - so the numbers agree from the first day.

Apache Superset
AI insights
Dynamic forecasting
Order management
F&B pre-order
Onboard POS

Browse our data analytics case studies

No items found.

Ready to see the whole picture

Let's walk through your current reporting and show what the same questions look like on one dataset.